Gage R&R Study (Crossed) in Minitab
Gage R&R Study (Crossed) is the most common method of Gage R&R in the industry. Crossed is used for reusable samples in experiments
 Pranay Kumar
Apr 24, 2018
22610
0
Pranay Kumar
Apr 24, 2018
22610
0

Gage R&R Study (Crossed) in Minitab
Gage R&R Study (Crossed) is the most common method of Gage R&R in the industry
Structure your data so that each row contains the part name or number, operator and the observed measurement. Parts and operators can be text or numbers. The Gage R&R studies require balanced designs (equal numbers of observations per cell) and repl icates.
To do a Gage R&R Study (Crossed) in Minitab-
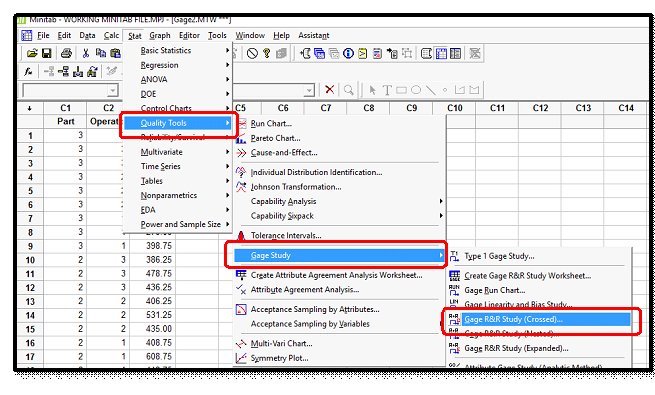
Choose Stat — Quality Tools — Gage R&R Study Crossed)

Gage R&R on Minitab
This is being done to ensure that the data is Accurate, Repeatable and Reproducible. If the Gage R&R study is successful the data can be used for further analysis
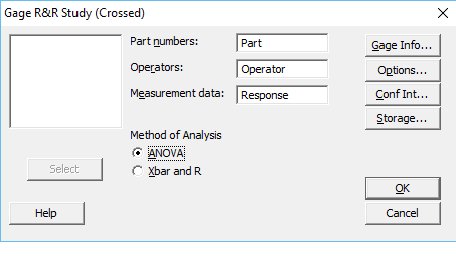
Gage R&R Image2
In Part numbers, enter the column of part names or numbers.
In Operators, enter the column of operator names or numbers.
In Measurement data, enter the column of measurements, and then click OK.
The Graph u shall receive:
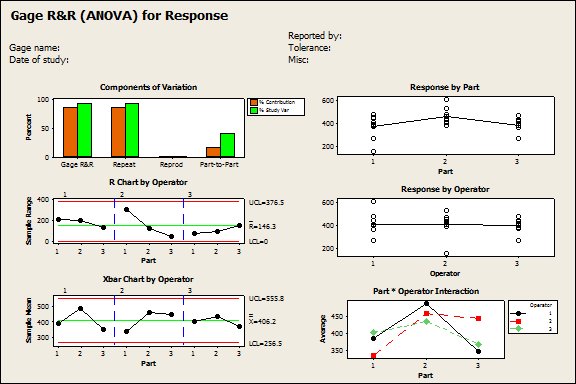
Gage R&R Graph received
Interpretation of Graph
Component of variation: this chart shows the breakup of variation into GRR and Part to part variation. GRR is further divided in to repeatability & reproducibility. (Information provided in the session window is presented in a form of chart)
Sample Range and Sample Mean:
Average of the reading of the each part for the each operator is plotted in the sample mean chart.
Range (max-min) for each part for each operator is plotted in the sample range chart. (In a good measurement system, the values will lie close to the central line.
Response by Part:
This chart shows how the same part has been measured by the different operators. In case of a good MSA the variation in the measured values will be less.
Response by Operator:
This chart shows how the different parts have been measured by the different operators. In case of good measurement system the charts for the different operators will look identical.
Part * Operator Interaction:
This chart shows how the same part has been measured by the different operators.
The session window shall show the following result
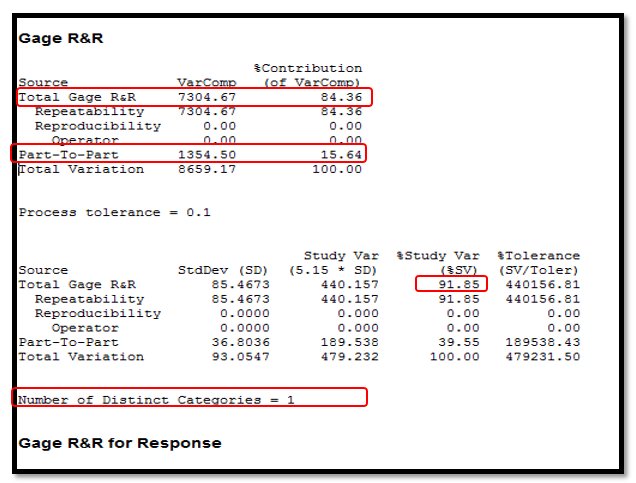
Gage R&R Result
Interpreting the result:
- Look at the Number of distinct categories shown, if it is greater than or equal to 4 – Accept the Measurement System else it may be considered inadequate.
- Check for % tolerance. If the % tolerance is less than 10% accept the measurement system else reconsider the measurement system
- Look at the % contribution of GRR against the Part to part, if GRR is considerably lower than Part 2 Part, accept the measurement system else reject and reconsider.
In the above example the MSA is inadequate.
For a deeper understanding of the subject, please visit the link for a detailed video.
URL : http://www.advanceinnovationgroup.com/blog/gage-rr-anova-test-using-minitab-explained-advance-innovation-hd/


Comments (0)
Facebook Comments