Pareto Chart
This video is prepared by Advance Innovation Group for Six Sigma practioners to help, understand and create Pareto chart using Minitab
 Pankaj Kumar
Apr 24, 2019
2726
0
Pankaj Kumar
Apr 24, 2019
2726
0

Pareto Chart
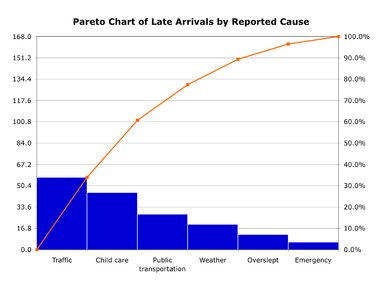
Pareto Chart is a graphical analysis tool that is used for decision making based on the Pareto Principle, known as the 80/20 rule. It is a decision-making technique that statistically separates a limited number of input factors as having the greatest impact on an outcome, either desirable or undesirable. Pareto analysis is based on the idea that 80% of a project’s benefit can be achieved by doing 20% of the work or conversely 80% of problems are traced to 20% of the causes. Pareto charts are extremely useful because they can be used to identify those factors that have the greatest cumulative effect on the system, and thus screen out the less significant factors in an analysis. Ideally, this allows the user to focus attention on a few important factors in a process.
Data – > Put Data in two columns. One columns should have nos. the other column should have some for those reasons.
Path- Stats -> Quality Tools -> Click defects table à Put reasons in Labels and Data in Frequencies. > Click OK – > Get Result
Making Pareto on Minitab by Advance Innovation Group
This is the first step on how to make pareto on minitab
Once the dialogue box opens like as below – choose the data to be analyzed.
Making Pareto using Minitab
Making Pareto using Minitab – Image2
Once the above is done and okayed.
Pareto Chart Image
Making Pareto Using Minitab


Comments (0)
Facebook Comments