Scatter Diagram
Scatter diagram are graphical tools that attempt to depict the influence that one variable has on another. Trend in the data that means correlation exists.
 Pankaj Kumar
Apr 24, 2019
7257
0
Pankaj Kumar
Apr 24, 2019
7257
0

Scatter diagrams are graphical tools that attempt to depict the influence that one variable has on another. Trend in the data that means correlation exists.
Scatter Diagram
Scatter diagrams are graphical tools that attempt to depict the influence that one variable has on another. This visual diagram helps us understand the relationship between two variables such as Height and Weight of people.
How to Read Scatter Plot
If we see trend in the data that means correlation exists. If this trend is upward rising then we call that there is positive correlation in those variables (i.e. increase in one variable leads to increase in another variable). If this trend is falling downward then we say, there exist negative correlation (i.e. increase in one variable leads to decrease in another variable and vice-versa). The only problem with scatter plot is that you always cannot predict the relationship precisely just by looking at this diagram.
Scatter plots in Minitab.
Put the data of variables in two columns, Path ->Graph > Scatter plot > (With Connect Line) > Ok > Fill Y variables and X variables > Ok > Get Result
Let us look at the steps involved in making Scatter Plot in Minitab
Making Scatter Plot in Minitab
How to make Scatter Plot in Minitab Step1
Once you have chosen the Scatter plot option, the below Dialogue Box Shall open
Making Scatter Plot using Minitab – Step2
How to make Scatter Plot using Minitab – Step2
Making the Scatter Plot for data Analysis
How to make a Scatter Plot using Minitab – Step3
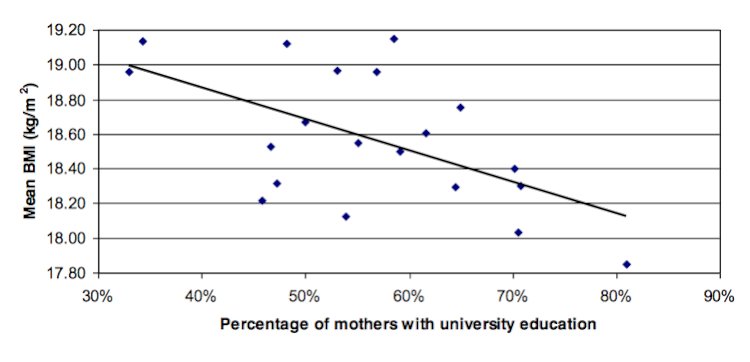
Once all the above is done, a scatter plot shall be published and you can then use the same to analyze the relationship between the variables. If you see the blue regression line it is poiting that the variables may be inversely related to each other i.e. with increase of one, the other variable shall decrease.
This is how Scatter Plot shall look like
How a Scatter Pot looks like


Comments (0)
Facebook Comments